Computational & Technology Resources
an online resource for computational,
engineering & technology publications
Civil-Comp Proceedings
ISSN 1759-3433
CCP: 75
PROCEEDINGS OF THE SIXTH INTERNATIONAL CONFERENCE ON COMPUTATIONAL STRUCTURES TECHNOLOGY
Edited by: B.H.V. Topping and Z. Bittnar
Paper 147

Critical Loading Events for the Assessment of Medium Span Bridges

C.C. Caprani+, S.A. Grave*, E.J. O'Brien+ and A.J. O'Connor*

+University College Dublin, Ireland *Trinity College Dublin, Ireland

Full Bibliographic Reference for this paper
C.C. Caprani, S.A. Grave, E.J. O'Brien, A.J. O'Connor, "Critical Loading Events for the Assessment of Medium Span Bridges", in B.H.V. Topping, Z. Bittnar, (Editors), "Proceedings of the Sixth International Conference on Computational Structures Technology", Civil-Comp Press, Stirlingshire, UK, Paper 147, 2002. doi:10.4203/ccp.75.147
Keywords: bridges, loading, traffic, trucks, statistics, simulation.

Summary
This paper describes the simulation of free-flowing traffic across bridges to predict the characteristic values for bridge load effects such as bending moment and shear force. It is generally assumed that the one- and two-truck free-flowing events are the most important for short to medium span two-lane bridges. This assumption is tested here. It is shown that, up to 50 m span, two or three trucks present on the bridge simultaneously are generally the critical free-flowing load case.

Real-time vehicle weights and frequencies were measured at a site in France using WIM technology. The data was analysed to determine the parameters of the statistical distributions that characterise that traffic flow [1]. Monte-Carlo simulation is used to generate a traffic file whose statistical distributions closely match those of the measured data. The simulations use influence lines to calculate the value of the load effects for any position and arrangement of truck(s). In this study two load effects were considered:

  • Effect 1: Bending moment at the mid-span of a simply supported bridge,
  • Effect 2: Bending moment at the central support of a two-span continuous bridge.
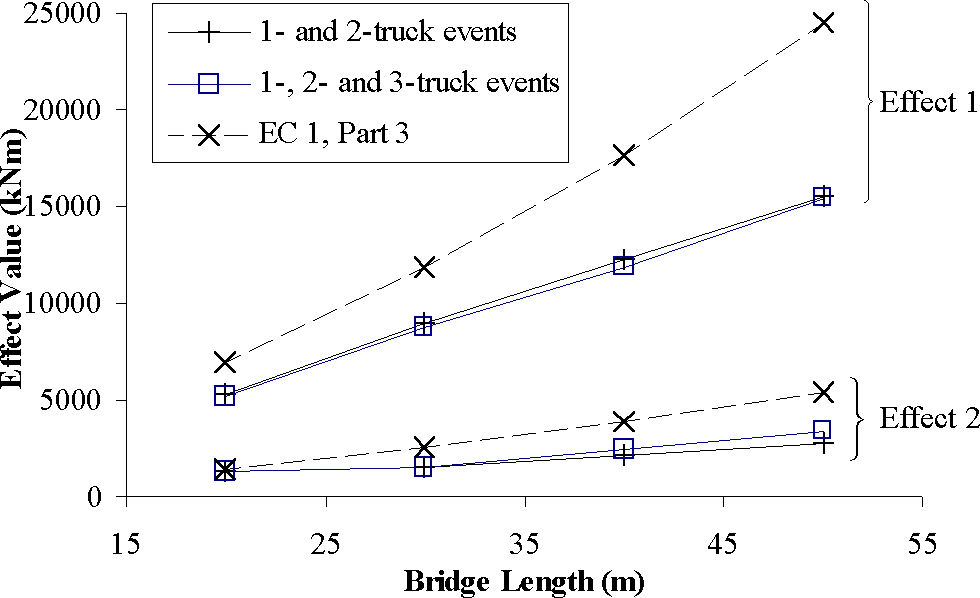
For each multiple truck presence event and single truck with gross vehicle weight over 50 tonnes, the trucks were moved in 0.01 second intervals across the bridge and the maximum load effects for the event identified. For each simulation, 240 hourly maximum values for each load effect were calculated. These were plotted on Extreme Value Type I (Gumbel) probability paper. Linearity of the plot in the tail region is evidence of a reasonable approximation to a Gumbel distribution. To assess the repeatability of the procedure, six full simulations were carried out. Results are shown to be reasonably consistent between runs. The mean values for all six runs are given in Figure 147.1. For comparative purposes, the corresponding design values in accordance with the Normal load model of EC 1, Part 3 [2], are also illustrated in the figure. The differences which arise from neglecting three-truck events can be seen. For Effect 2, particularly for longer bridge lengths, there is a reduction in the characteristic value when the three-truck events are ignored. This is to be expected as a number of extreme loading situations have been omitted from consideration. The difference between the two cases increases to 19.1% for a bridge length of 50 m. For Effect 1, neglecting three-truck events tends to result in an increase in the characteristic values. This difference is quite small; the maximum difference is 3.7% at a length of 40 m.

It is clear in Figure 147.1 that the implications of neglecting three-truck events depends quite significantly on the effect considered. As the same traffic was used, this can only be attributed to the characteristics of the influence line under consideration. The influence line for Effect 2 has a less pronounced peak than Effect 1. In particular, the length for which the influence line exceeds 80 44 a greater chance that three trucks may be located in the critical zone to induce a larger effect than two trucks. This fact may account for the differences between Effect 1 and 2 in Figure 147.1. The authors conclude that, in assessing site-specific bridge loading for bridge lengths up to 50 m and in free flowing situations, both two- and three-truck events should be modelled.

Figure 147.1: Mean 1000-year extrapolated values plotted against length

References
1
Grave, S.A.J., O'Brien, E.J. and O'Connor, A.J., "The determination of site- specific imposed traffic loadings on existing bridges", Bridge Management 4, Eds. M.J. Ryall, G.A.R. Parke and J.E. Harding, Thomas Telford, 2000, pp. 442-449.
2
EC 1: Basis of design and actions on structures, Part 3: Traffic loads on bridges, European Prestandard ENV 1991-3: European Committee for Standardisation, TC 250, Brussels, 1994.

purchase the full-text of this paper (price £20)

go to the previous paper
go to the next paper
return to the table of contents
return to the book description
purchase this book (price £125 +P&P)